For these graphs I joined two different datasets on Switzerland. The first was a .shp file which included the boundaries of all the kantons and also had population data. The second dataset detailed how many drivers had there lisences revoked in each kanton and the reason why it was taken away. This second dataset did not contain any geographic infomation but I was able to join the two sets as they both had the column kanton.
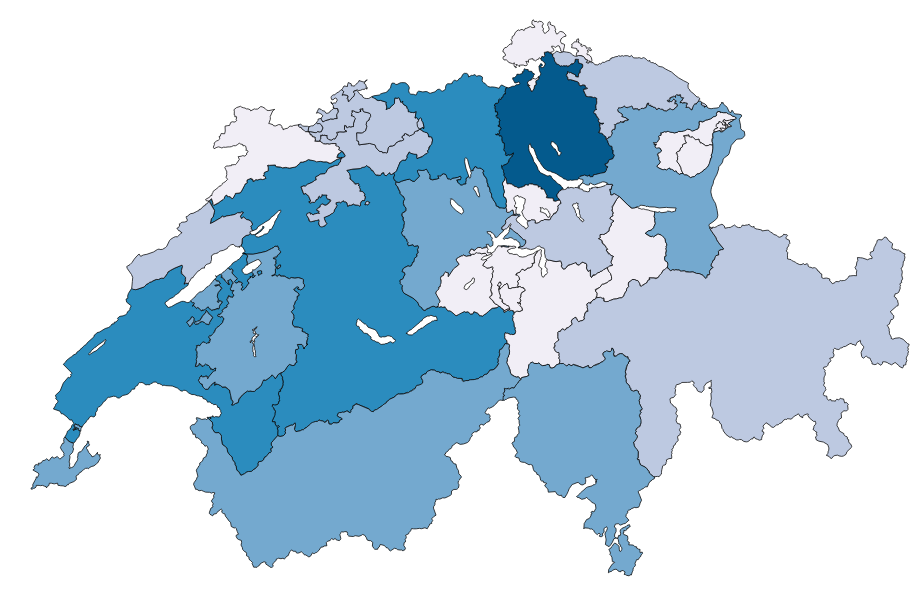
The first map shows the total number of drivers licenses revoked in the year 2012 in each kanton. As it is possible to see from the map, Zurich has had the highest number of incidents but it is also the most inhabitants.
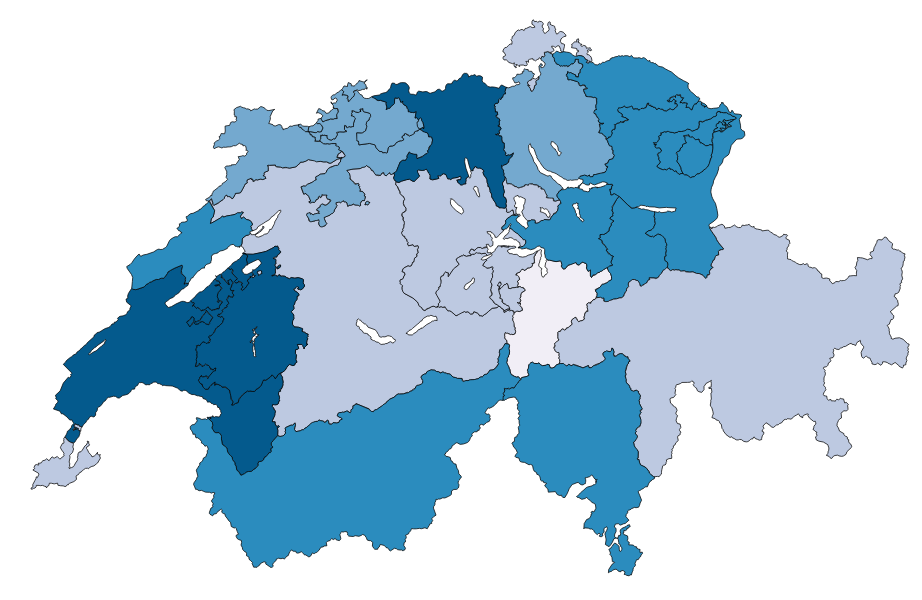
The second map shows the percentage of licenses revoked in each kanton. I think that this is a more accurate representation as it takes into account population. In the previous map the number of lisences revoked in Zurich was far higher than anywhere else whereas this map shows that the number is not abnormal.
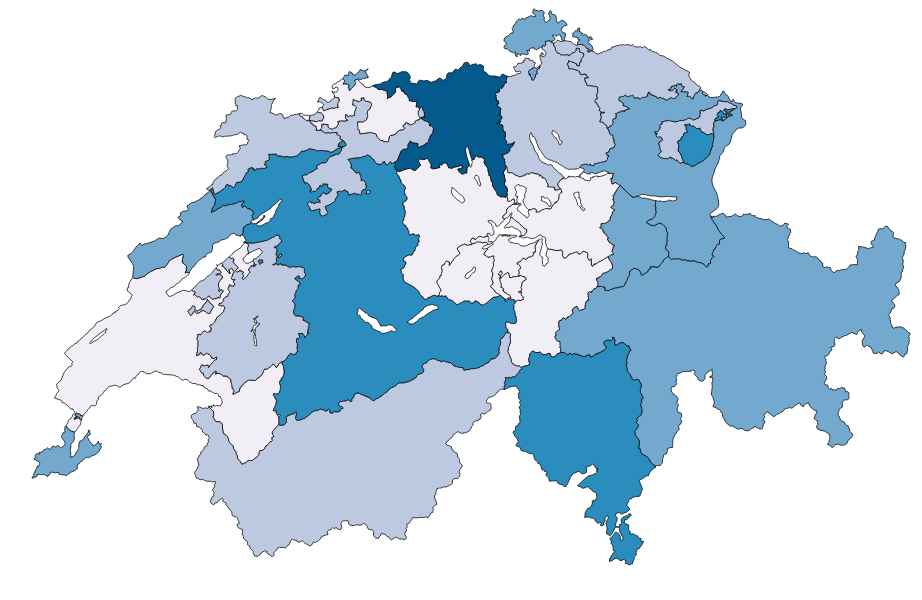
This final map shows the total number of licenses lost due to alcohol dependencies in each kanton.